
| Authors: Borzi R.M., Olivotto E., Pagani S., Vitellozzi R., Neri S., Battistelli M., Falcieri E., Facchini A., Flamigni F., Penzo M., Platano D., Santi S., Facchini A., Marcu K.B. |
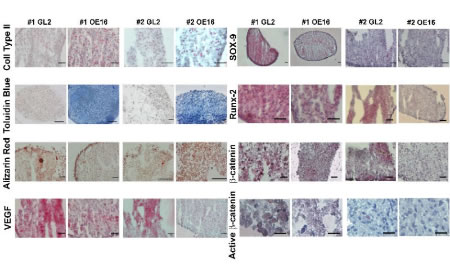 Images in support of the data shown in Figures 2,3 and 4 (additional results are shown for 2 independent patients, GL2 vs. MMP-13 KD micromasses) Left panel: ECM (type II collagen as assessed by IHC and GAG as assessed by toluidine blue), mineralization (calcium deposition visualized by alizarin red staining) and VEGF (a mediator of angiogenesis). Images shown were magnified to different degrees to show more global or targeted views of specific areas (bar =50 μm). First row: collagen 2 (1 and 3 weeks); second row: toluidine blue (3 weeks); third row: alizarin red (1 and 3 weeks); fourth row: VEGF (1 and 2 weeks). Right panel: For each differentiation marker (Sox9, Runx2, total β-catenin and activated β-catenin) there are mages magnified to different degrees to show either more global or targeted views of specific areas (bar =50 μm). First row: Sox9 (1 week mm); second row: Runx2 (2 weeks mm); third row: total β-catenin(3 and 2 week mm); fourth row: activated β-catenin(3 week mm). 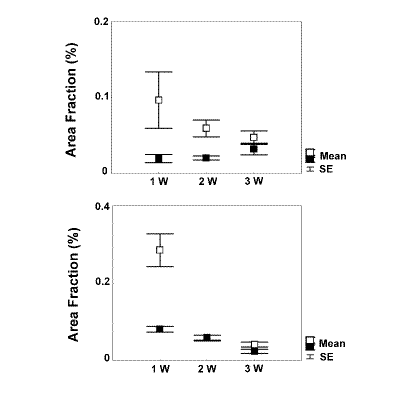 Quantitative image analysis of Sox9 expression was performed in maturing micromasses from three different patients by Nikon imaging software as described in Materials and Methods. Results are for two patients with graphs showing the mean±SEM of the “area fraction” (i.e. the percentage area of positive signal with respect to the total area of the tissue examined), in 6 to 15 different fields for each sample. Statistical significant higher staining in GL2 micromasses (empty boxes) compared to OE16 (MMP13-KD) micromasses (filled boxes) in the upper patient at 1 week (p=0.0016) and 2 week (p=0.0011), and for the lower patient at 1 week (p=0.0003). 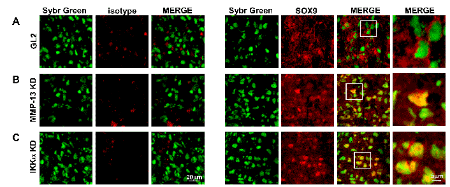 Confocal analysis of Sox9 subcellular distribution in 1 week micromasses: Sybr Green nuclear staining, normal isotype goat IgG (control sections), or Sox9 staining, and merge. Areas identified by the white square are shown at higher magnification on the right. A: GL2 control micromasses; B: MMP-13 KD micromasses; C: IKKa KD micromasses Streptavidin Alexa Fluor 647 labeled anti-Sox9 and Sybr green labeled DNA signals were co-localized by confocal imaging with a Radiance 2000 confocal laser scanning microscope (BioRad), which was equipped with Nikon 40x 1.3.A and Nikon 60x, 1.4 N.A. objectives and argon-krypton and red diode lasers to excite Sybr Green and Streptavidin Alexa Fluor 647 fluorescence, respectively. Samples were excited at 488-and 637-nm with argon-krypton and red diode lasers, respectively for dual detection of Sybr green and Streptavidin Alexa Fluor 647. The Sybr green emission signal (rendered in green) was detected by a photomultiplier tube preceded by a barrier filter (BP 515/30 nm), and the Streptavidin Alexa Fluor 647 emission signal (rendered in red) was detected by a dichroic mirror (650 nm) and barrier filter (LP; 660 nm). Optical sections were obtained at increments of 0.5 or 0.3 μm in the Z-axis, (when using either a 40x or 60x objective, respectively), and were digitized with a scanning mode format of 512x512 pixels and 256 gray levels. Image processing and volume rendering was performed with ImageSpace software (Molecular Dynamics, Inc., Sunnyvale, CA), running on an Indigo workstation (Silicon Graphics, Mountain View, CA). |
Main container